Manifold Cities
2014 was the first year in which more than half of the world population lived in cities; by 2050 it will be 85 percent. Understanding the social dynamics of cities is as an importat goal that may enable us to build better cities in the future.
We studied the 2011 census data in a new way to discover the main social variables in Bristol, UK. We found that the density of the university students and economic deprivation are the most important factors that shape Bristol.
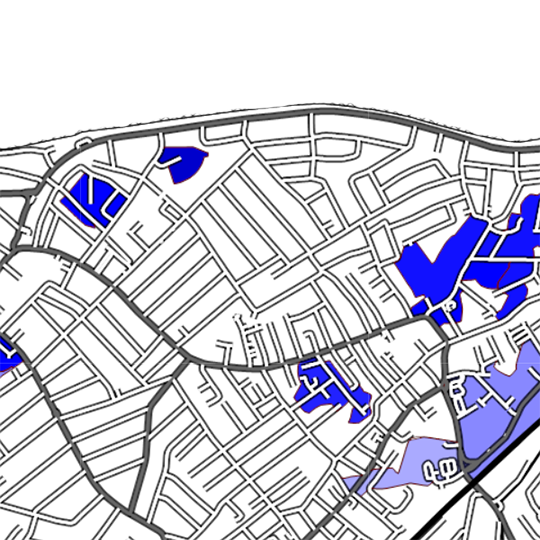
Shown on this site is a map of deprivation across the city (blue area). When studying this map please keep in mind that it is based on data from 2011 and although we use a very sophisticated analysis that avoids many of the biasses of other approaches, there is some margin of statistical errors.
The base map was generated using data from Open Street Map. We used Maperativ by Igor Brejc to generate the map and Leaflet to show it on this site. More details on the analysis can be found in our paper below: